How do you graph the polar equation #r=-3sintheta#?

1 Answer
May 28, 2018

please show the graph below

Explanation:

As #r=-3sintheta# ,at #theta=0,pi/4,pi/2,(3pi)/4 and pi#

#r# takes values #r=0,(-3)/sqrt2,-3,(-3)/sqrt2,0#

Thus these represents points #(0,0),((-3)/sqrt2,pi/4),(-3,pi/2),((-3)/sqrt2,3pi/4),(0,pi)#

We can select more such points, say by having#theta=pi/6,pi/3,(2pi)/3, (5pi)/6#

the graph will be appear as follow:

james

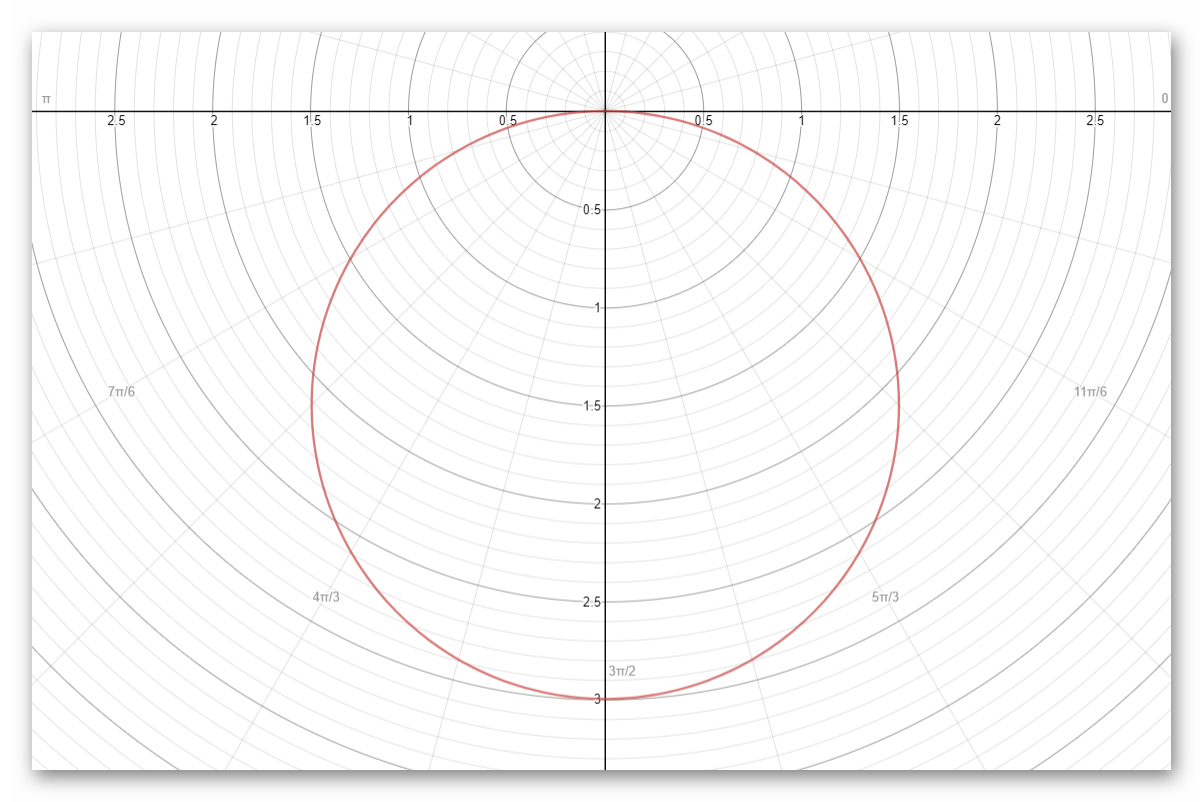
it is a circle with center #(-3/2,-pi/2)# and radius #r=3#

as #r=-3sintheta# it means #r^2=-3rsintheta#

#x^2+y^2=-3y#