How do you graph y< x + 4 and x- 2y = 10?
1 Answer

Please read the explanation.
Explanation:
Given the Compound Inequality:
Next, consider
We will bring it down to Slope-Intercept Form.
Subtract
Multiply both the sides by
Rearrange the terms:
Divide both sides by
Now, we have the equation in Slope-Intercept Form.
We will create data tables using both the intermediate results:
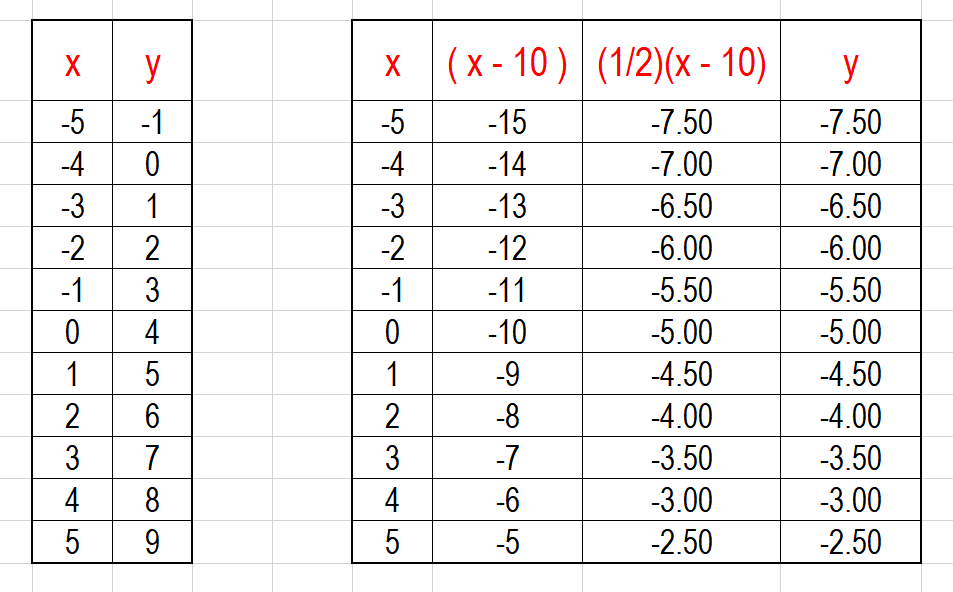
The first
The second
Next, we can graph:
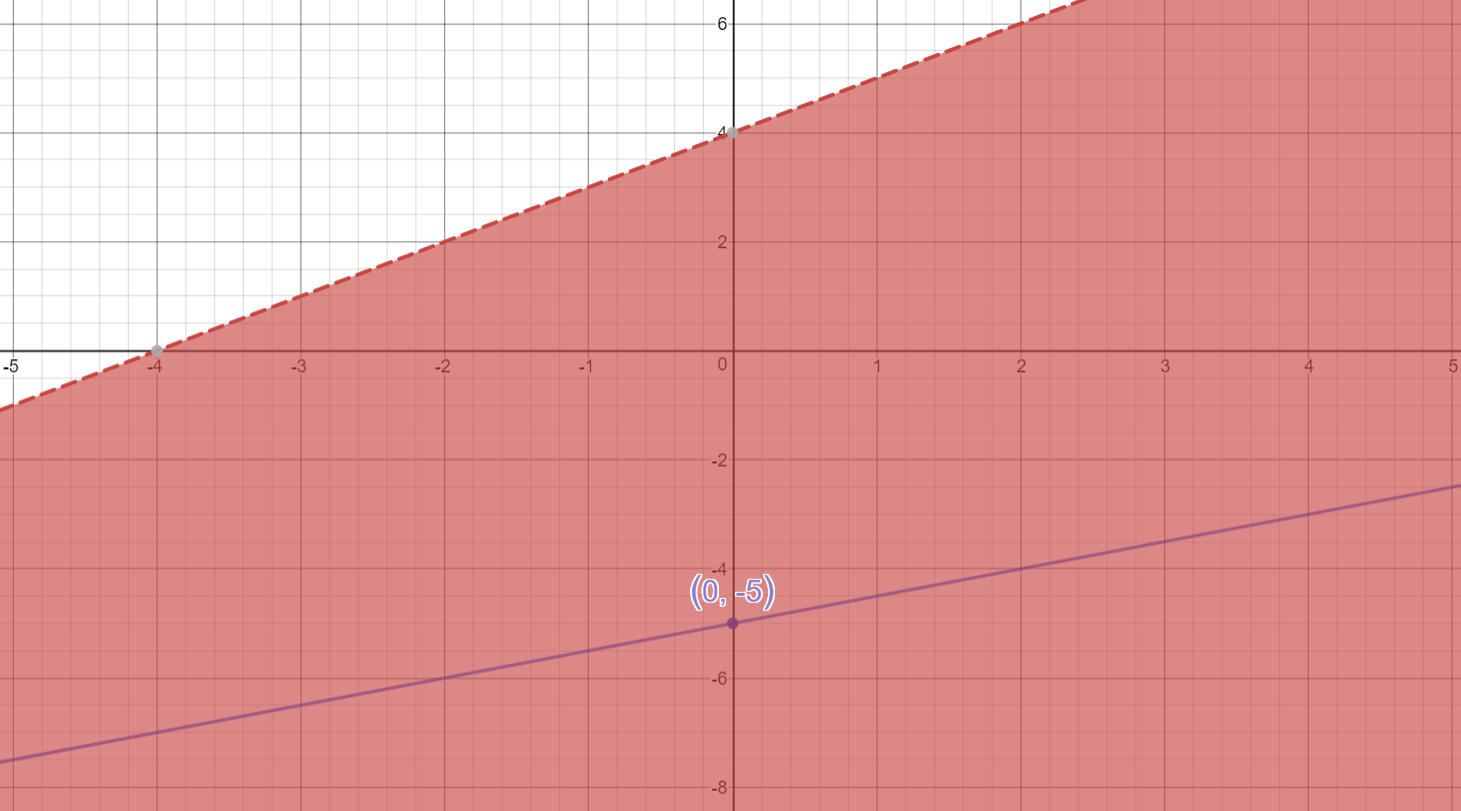
Dotted line are values NOT part of the solution.
Shaded area is the solution region for the inequality.
The second equation is a linear equation creates a straight line.
Since
This would mean, points lying on the straight line, for the equation below, will be the final solution.
Points on the straight line common for both the graphs is the final solution.
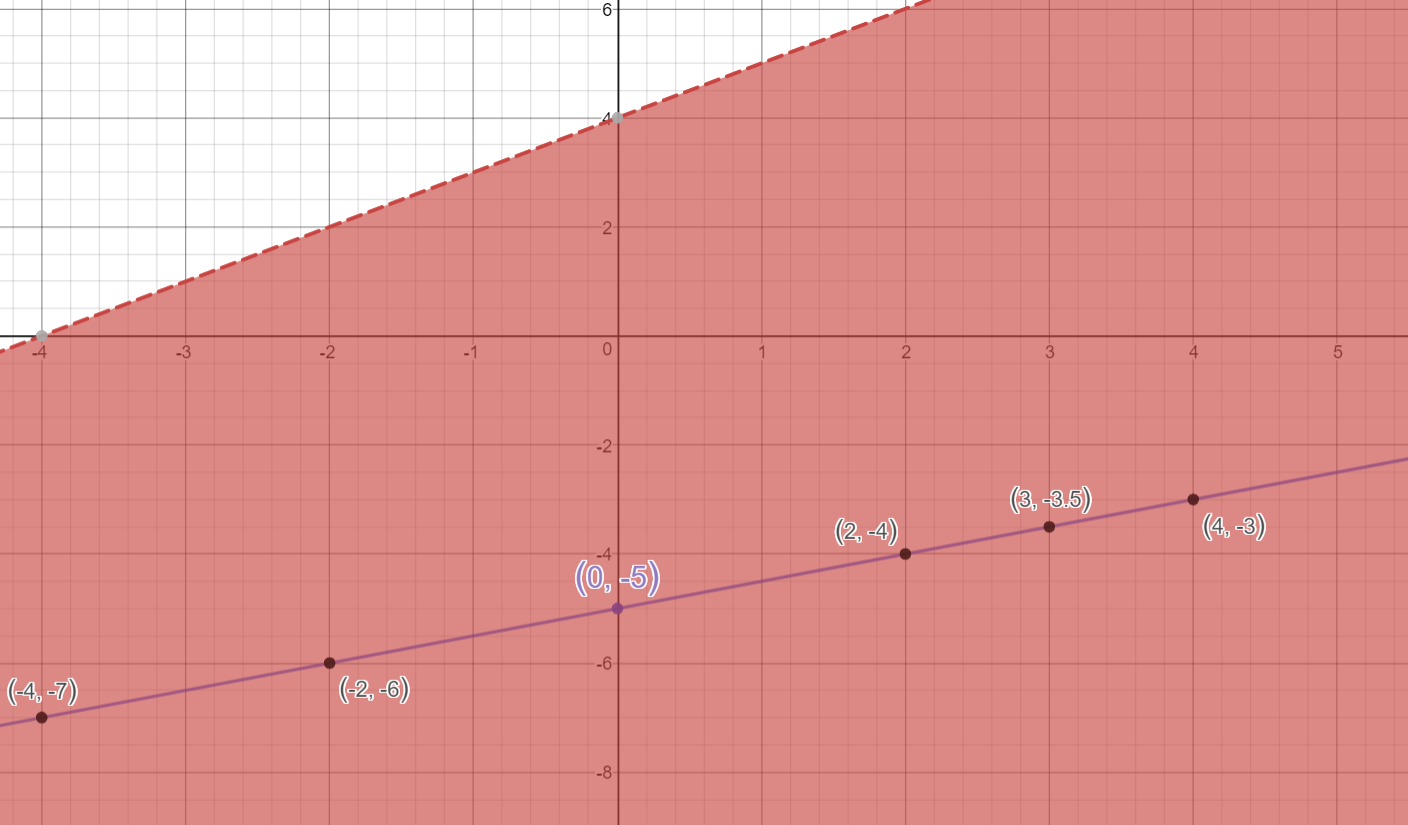
Observe that NOT ALL POINTS on the line belong to the solution:
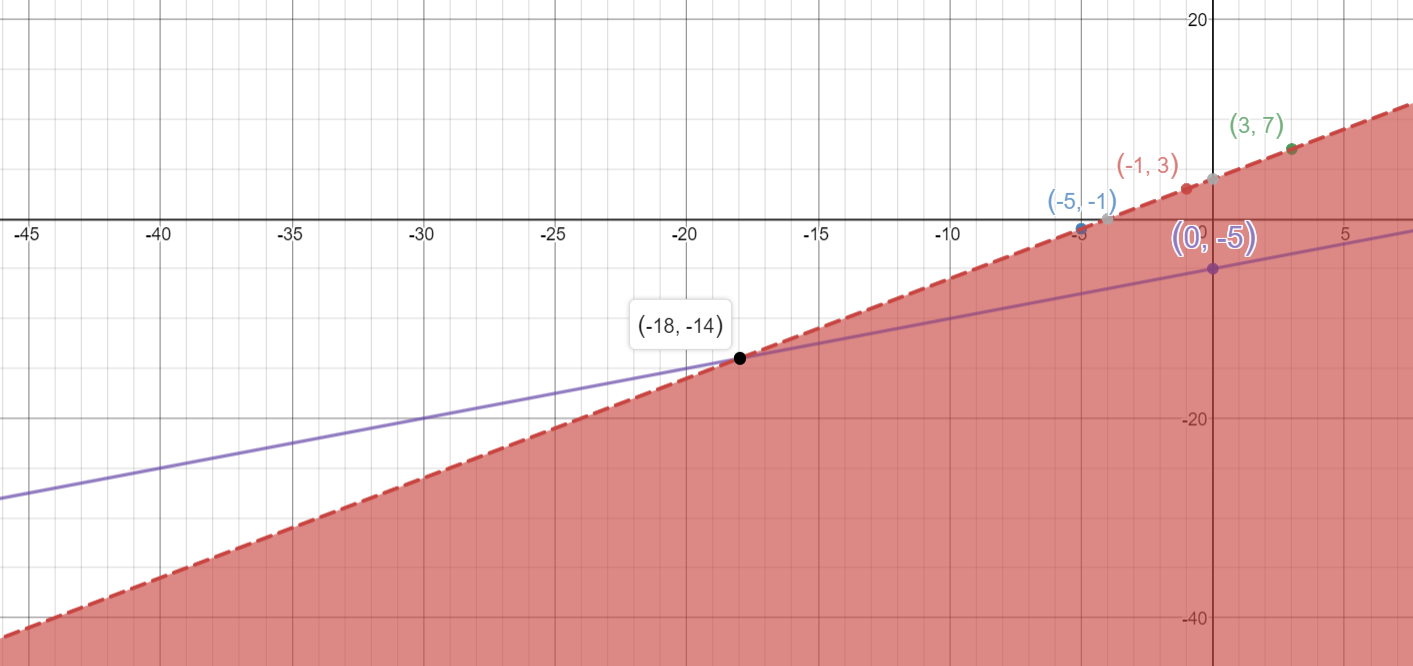
Points beyond
Hope it helps.
