How do you make the graph for #y=ln(1+x/(ln(1-x)))#?
2 Answers
It looks to me like Socratic graphing cannot plot it for some reason.
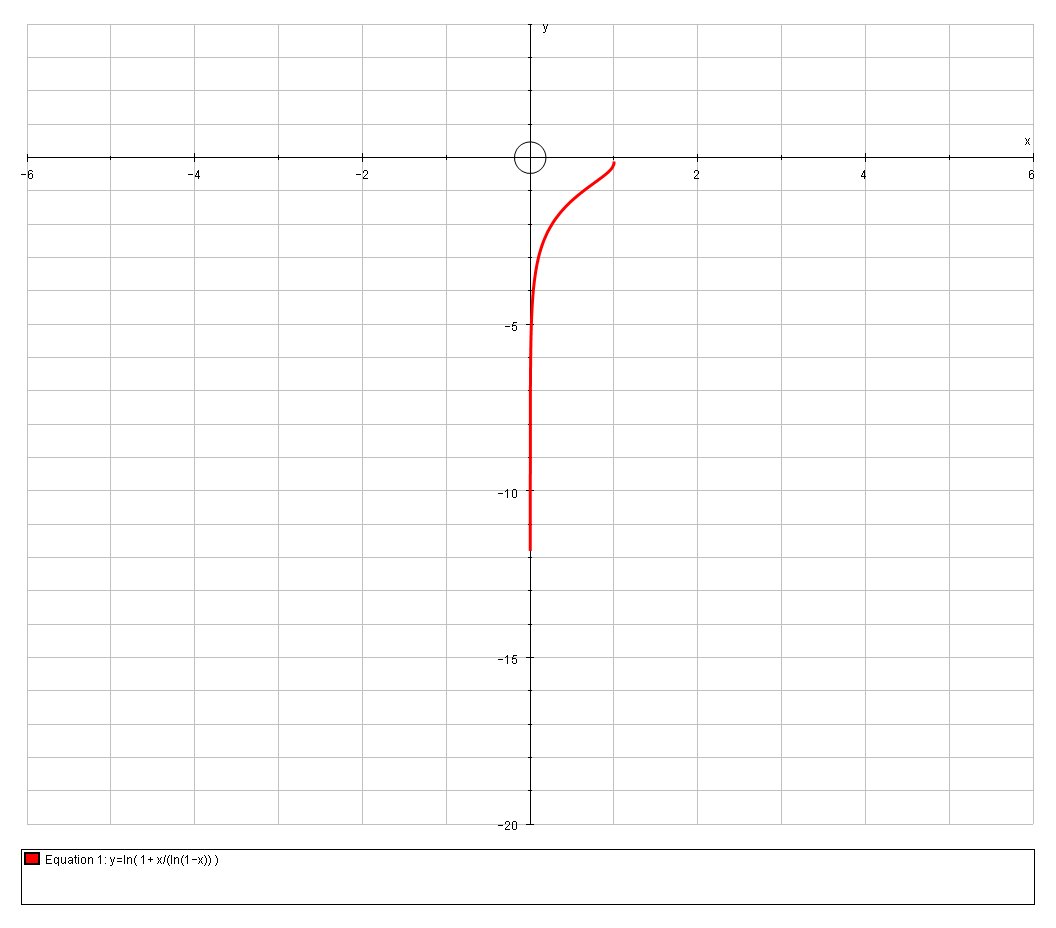
This is the graph:

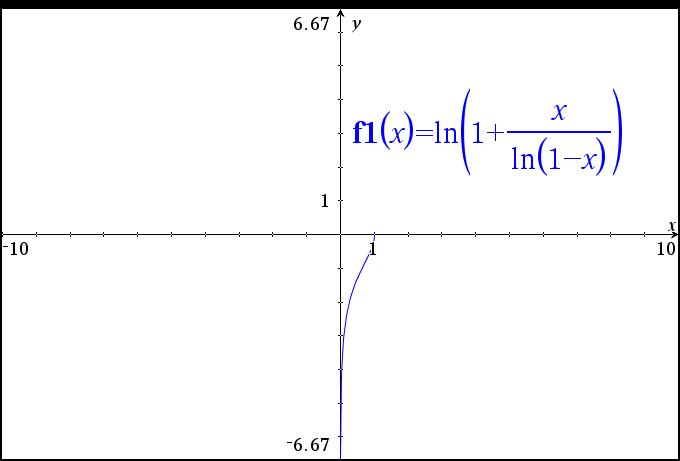
And my calculator can plot it also:

See Socratic graph and explanation.
Explanation:
To make y real,
So, if
Also, the upper terminal of the graph is
end is
Now,
function. I realize that the lower end is lower than
I hope that , with the interest already shown, Steve could study my
answer and give his comments.
graph{x-(e^y-1)ln(1-x)=0 [-2.5, 2.5, -1.25, 1.25]}
@a-s-adikesavan
I've embedded my comments in the answer rather than as a comment due to all the maths:
For the domain of the function:
Condition 1
#1-x>0# so that#ln(1-x) in RR => color(red)(x<1)#
This is consistent with your answer
Condition 2
I get a different result for the 2nd condition; as follows'
#1+x/ln(1-x) > 0# so that#ln(1+x/ln(1-x)) in RR#
As we are solving an inequality we need to be careful with the sign of the denominator
Using the fact that for any
# ln A \ \ \ { (>0), (=0), (<0) :} \ \ iff {: (A>1), (A=1), (A<1) :}#
Lets examine the three cases:
Case 1:
#\ \ color(blue)(ln(1-x)>0)#
#ln(1-x)>0 =>1-x>1=>x<0 #
With this requirement, we have:
#1+x/ln(1-x) > 0 #
# :. ln(1-x)+x>0 # (as#ln(1-x)>0# )
And this has no real solutions:Case 2:
#\ \ color(blue)(ln(1-x)=0)#
#ln(1-x)=0 =>1-x=1=>x=0 #
This case would lead to#x/ln(1-x)# being of an indeterminate form#0/0# , so lets use L'Hôpital's rule to find the limit:
#lim_(x rarr 0)(1+x/ln(1-x)) = 1+lim_(x rarr 0)(x/ln(1-x))#
#" "= 1+lim_(x rarr 0)(1/(1/(1-x)(-1)))#
#" "= 1-1#
#" "= 0#
and as we require#1+x/ln(1-x)>0# we can eliminate this.Case 3:
#\ \ color(blue)(ln(1-x)<0)#
#ln(1-x)<0 =>1-x<1=>x>0 #
With this requirement, we have:
#1+x/ln(1-x) > 0 #
# :. ln(1-x)+x<0 # (as#ln(1-x)<0# )
Using WFA and graphs this has the solution#color(red)(x>0)#
Combining all the results gives the domain of
Thanks to some help from @jimh we have
# lim_(x rarr 0)ln(1+x/ln(1-x)) rarr -oo#
But it does so extremely slowly due to the effect of the
Due to the fact that very rapidly we can be dealing with very small numbers with many decimal places, the computer accuracy is a issue when displaying the graph of the function.
Eg
Other than looking at derivatives I'm not sure there is much more to add

