How do you sketch the graph that satisfies f'(x)=1 when x>-2, f'(x)=-1 when x<-2, f(-2)=-4?
1 Answer
Explanation:
For
For
We want
Combining the results we get:
# f(x) = { (-x+a, x < -2), (-4, x = -2), (x+b, x > -2) :}# where#a,b# are constants
If we wanted a continuous solutions then we would need:
For
#x < -2 => 2+a = -4 \ \ \ \ => a=-6 #
For#x > -2 => -2+b = -4 => b=-2 #
And so:
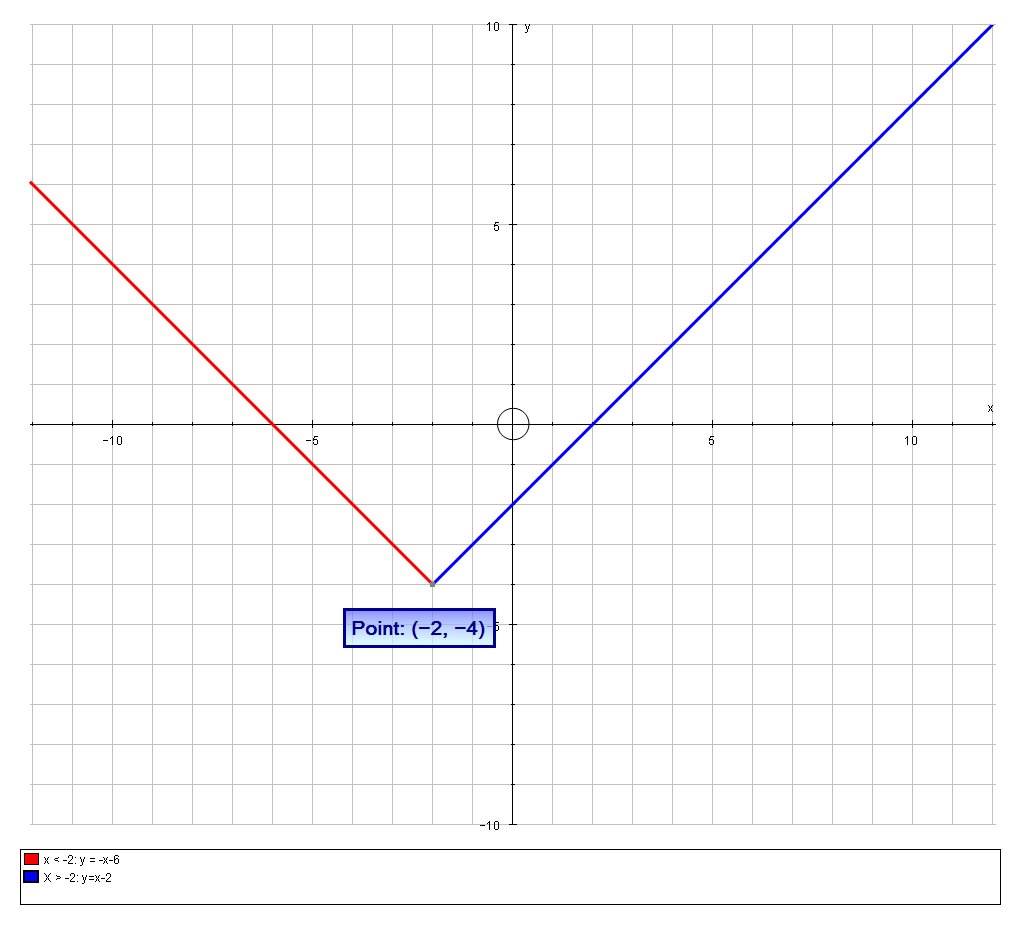
# f(x) = { (-x-6, x < -2), (-4, x = -2), (x-2, x > -2) :}#
Which we can graph as follows:

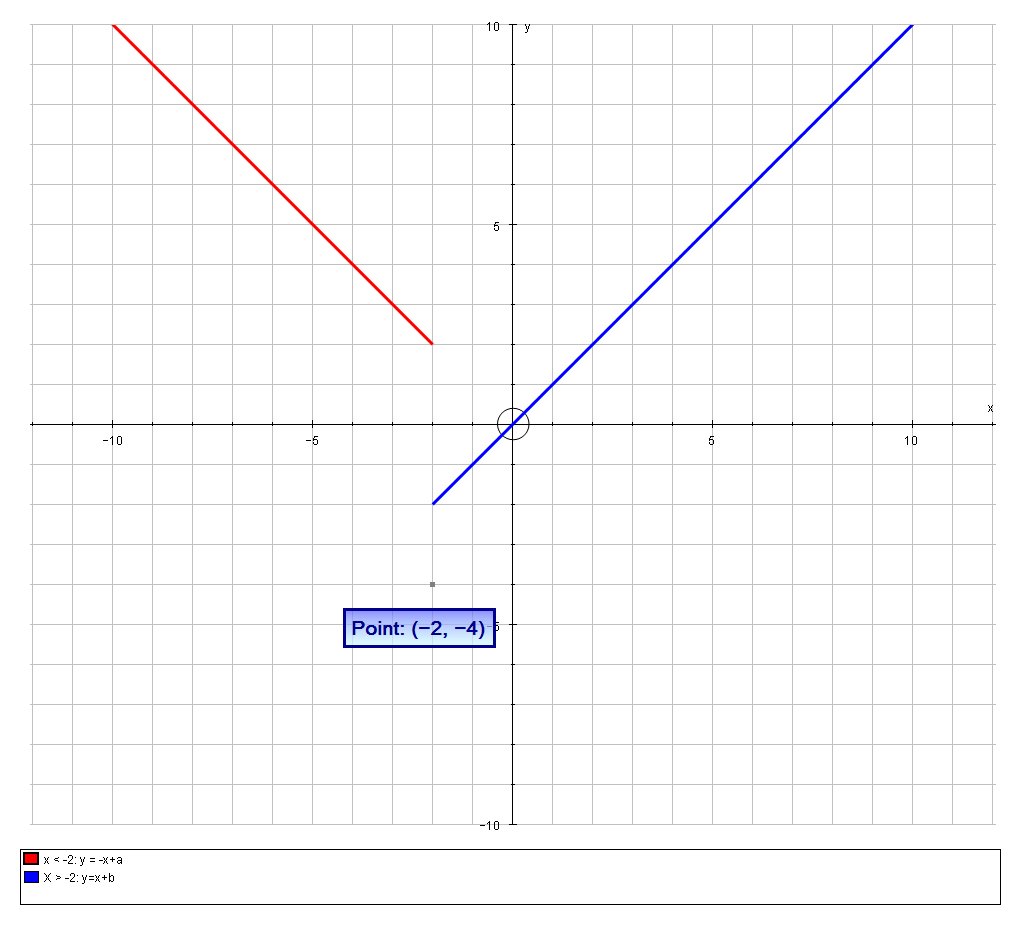
But equally we could choose any values for the arbitrary constants
# f(x) = { (-x, x < -2), (-4, x = -2), (x, x > -2) :}#
Which we can graph as follows:


