How do you use the first and second derivatives to sketch #h(x)=x³-3x+1#?
1 Answer
First derivative will give us critical points:
Points that represent potential local maximum/minimum values or aymptotes
Plugging in values on either side of these critical points will show how the curve is acting (ie. positive/negative slopes)
Second derivative will give us inflection points:
Points in which the curve changes concavity
...As well as tell us if the curve is concave up/down.
Explanation:
So, lets first take the derivative of
Check the intervals around the critical values:
For
For
For
This should make sense since we started with a cubic function.
These changes in slope indicate local extrema.
Local maximum at
Local minimum at
Now, lets take the second derivative:
Check the intervals around this value.
For
For
Thus, there is an inflection point at x=0.
Now that we have all that information, we should gather up some basic information to help us plot.
Let's find some intercepts by plugging in 0 for x into the original function f(x).
y-intercept
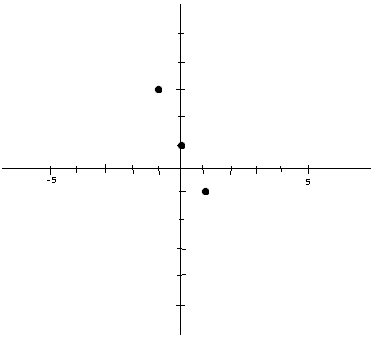
Plug in our extrema values and plot those.

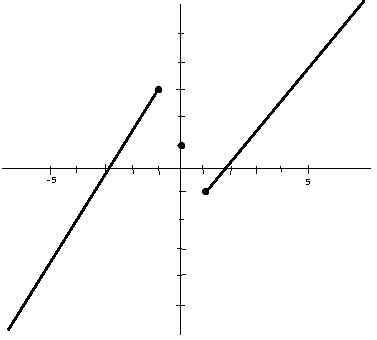
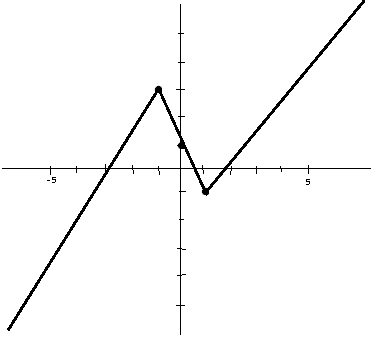
Now, we know how the graph acts based on those intervals:
Increasing from

Decreasing from

Now concavity; since we know that the function is differentiable along the
Concave down from
Concave up from
graph{x^3-3x+1 [-5.304, 5.796, -2, 3.546]}

