How do you sketch the graph of f(x)=x^3-3x^2?
2 Answers

Calculate derivative :
So you can study the sign of
f'(x) < 0 iff x in ]0,2[ f'(x) > 0 iff x in ]-oo, 0[ cup ]2,+oo[ .
You get now the variations of
-
-
Remark that
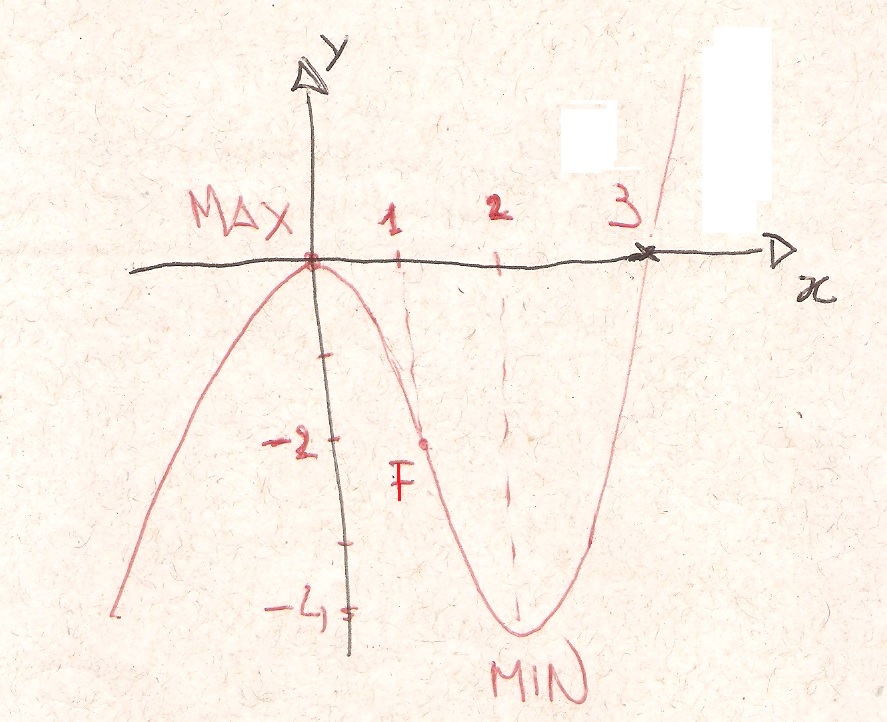
- local maximum in 0 with
- local minimum in 2 with
There are two horizontal tangents at 0 and at 2.
- For the limits, apply the rule :
lim_{x->-oo} x^3-3x^2 = lim_{x->-oo} x^3 = -oo
lim_{x->+oo} x^3-3x^2 = lim_{x->+oo} x^3 = +oo
Finally :
graph{x^3 - 3x^2 [-8.42, 13.78, -6.62, 4.48]}

You can start by setting
Setting
When
Points of maximum or minimum are found by setting the first derivative equal to zero:
and
and
When
Setting the second derivative equal to zero will give us inflection point(s):
and
so that
And finally: