How do you graph the equation y=-3/7x+2?
1 Answer

See a solution process below:
Explanation:
This equation is in slope intercept form. The slope-intercept form of a linear equation is:
Where
Therefore:
The
The slope is:
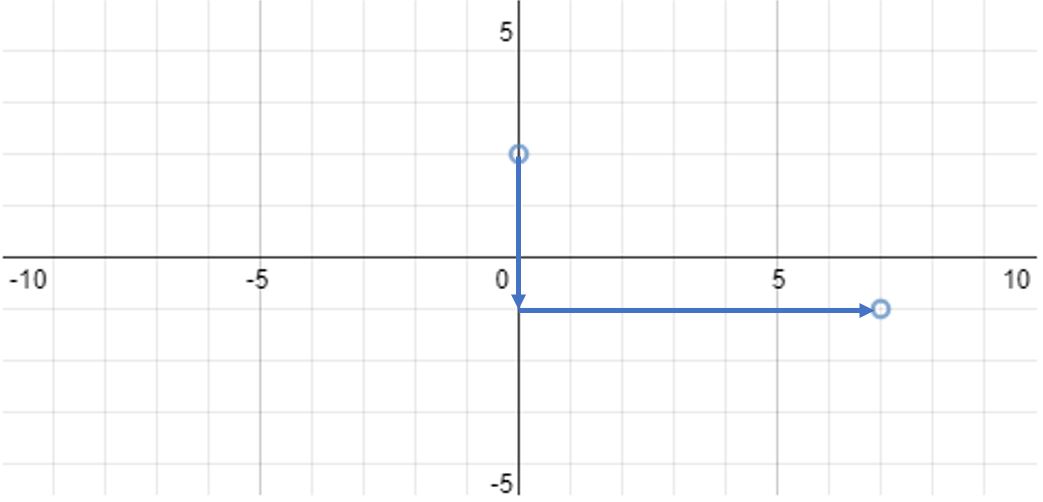
Slope is rise over run. So the line will go down
We can plot the
graph{(x^2+(y-2)^2-0.025)=0}
We can plot the next point by going down
We can now draw a line through the two points to graph the line:
graph{(y + (3/7)x - 2)((x-7)^2+(y+1)^2-0.025)(x^2+(y-2)^2-0.025)=0}
