How do you graph the system of linear inequalities #-x<y# and #x+3y>8#?
1 Answer

Graph the inequalities as if they are equations (but let the lines be dashed if the inequality is merely "less than" or "more than"), then shade accordingly.
Explanation:
Our first inequality is
To start, graph
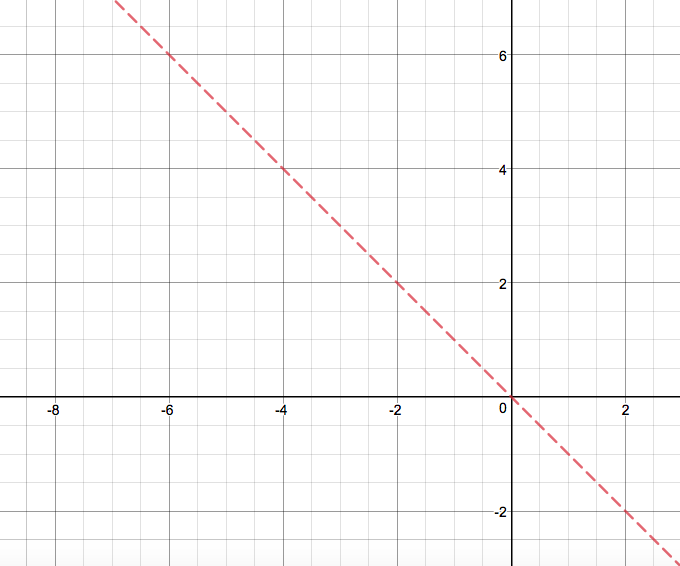
I chose to draw a dashed line here because the inequality only says "
Then what would
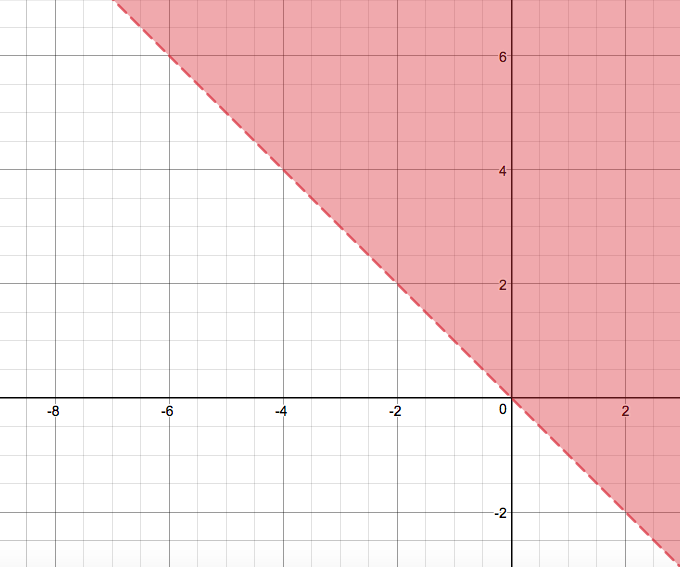
Notice how I left the line dashed.
The second inequality is
Let's rearrange that to put it in the slope-intercept form of linear equations,
Subtract
Then divide by
Let's graph the (dashed!) line
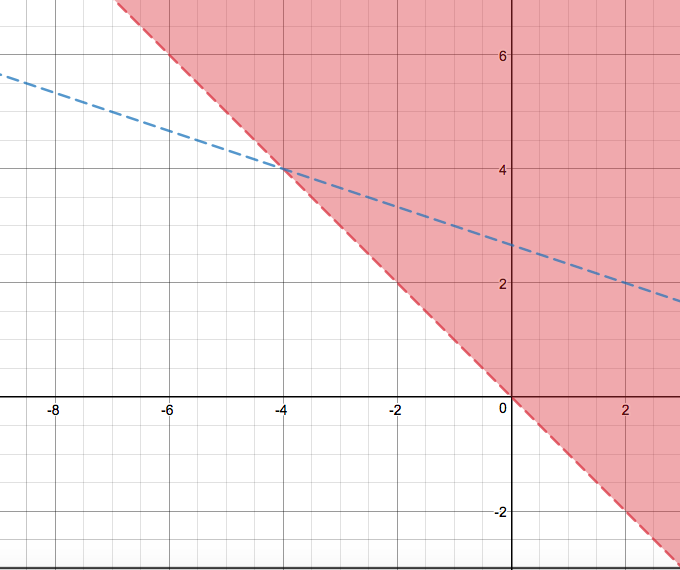
Again, the inequality asks us to shade everything above the line.
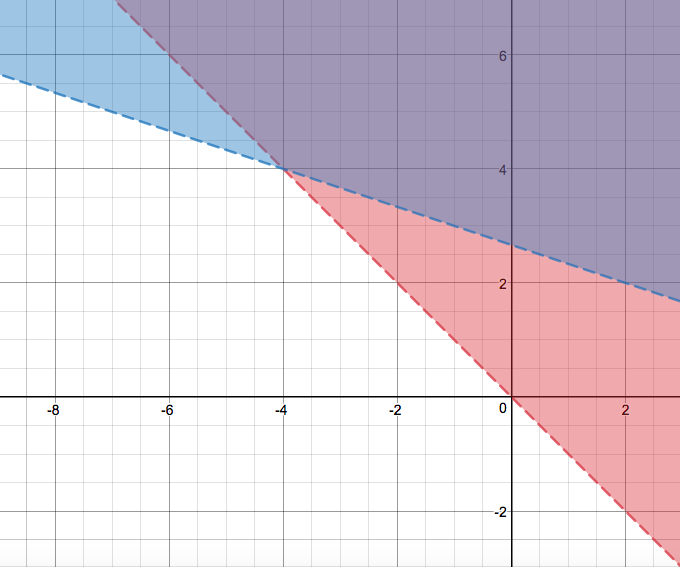
The purple area is the shaded area that both inequalities share.
