How do you graph the inequality #6x+3y>12#?

1 Answer
Mar 2, 2018

Let's isolate #y#:

#6x+3y > 12#

#3y > 12 - 6x#

#y > (12-6x)/3#

#y > 12/3 - (6x)/3#

#y > 4 - 2x#

Now we have the information we need to graph this:

This looks an awful lot like slope-intercept form, where #y = color(orange)(m)x + color(green)(b)# with #color(orange)(m)# being the slope and #color(green)(b)# being the #y#-intercept

In our case, we have # y > color(orange)(-2)x + color(green)(4)#

This tells us that our graph has a slope of #-2/1# or down #1#, over #1# and a #y#-intercept at #4#.

graph{y = -2x+4}

Now, we need to figure out if the graph shows a dashed or solid line. This is pretty simple: does the inequality sign include a value #(>= or <=)# or does it exclude values (#< or >#)#? If it includes values, it is a solid line. If it does not, and excludes values, then we use a dashed line.

So in our case, our graph will have a dashed line because it has the #># sign.

The question is, which side of the graph do we include? There are a few ways to check, but I like a simple method: pick two points, one from each side of the graph. THESE POINTS CANNOT BE ON THE GRAPH Whichever one makes the statement true is correct

Let's pick #(0, 0)# and #(2, 2)# No need to make the math hard :)

#* * * * * * * * * * * * * * * * * * * * * * * * * * * * * * * *#

#0 > -2(0) + 4#

#0 > 4#

is this true? is #0# larger than #4#? No it is not, so the inequality isn't on this side

#* * * * * * * * * * * * * * * * * * * * * * * * * * * * * * * *#

#2 > -2(2) + 4#

#2 > -4+4#

#2 > 0#

is this true? is #2# larger than #0#? Yes it is, so the inequality is on this side

enter image source here

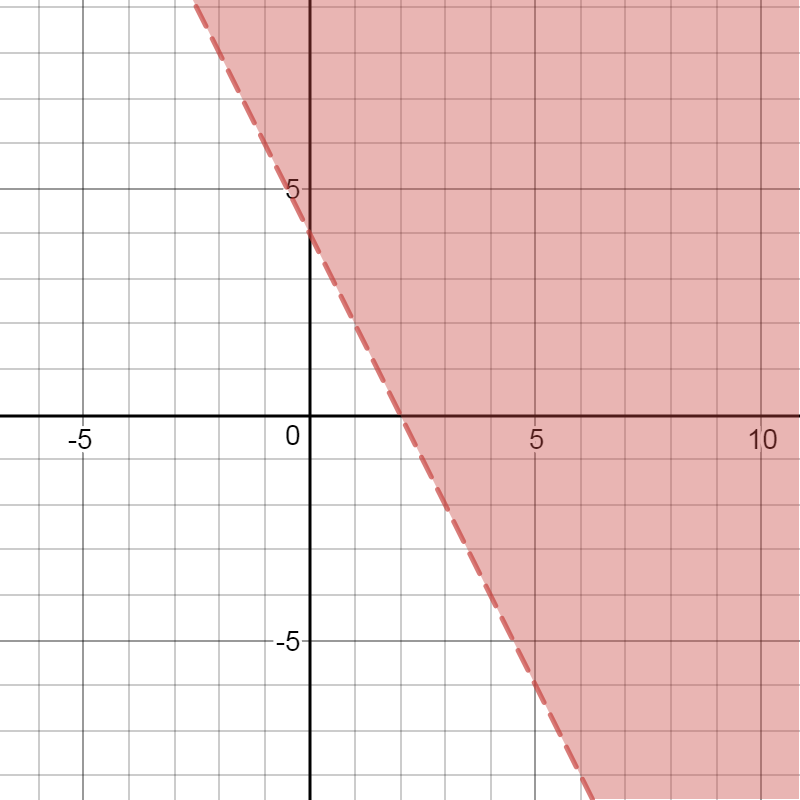
*This graph was obtained form https://www.desmos.com/calculator/sqb3smcrdv*