How do you graph #r=2sintheta#?

1 Answer
Apr 8, 2018

Please see below.

Explanation:

As #r=2sintheta#, at #theta=0,pi/4,pi/2,(3pi)/4# and #pi#

#r# takes the values #0,sqrt2,2,sqrt2,0#

Thus these represents points #(0,0)#, #(sqrt2,pi/4)#, #(2,pi/2)#, #(sqrt2,(3pu)/4)# and #(0,pi)#.

We can select more such points, say by having #theta=pi/6,pi/3,(2pi)/3, (5pi)/6# and corresponding value of #r# would be #r=1,sqrt3,sqrt3,1# and points are #(1,pi/6)#, #(sqrt3,pi/3)#, #(sqrt3,(2pi)/3)# and #(1,(5pi)/6)#.

The gaph will appear as follows:

created using utility at desmos

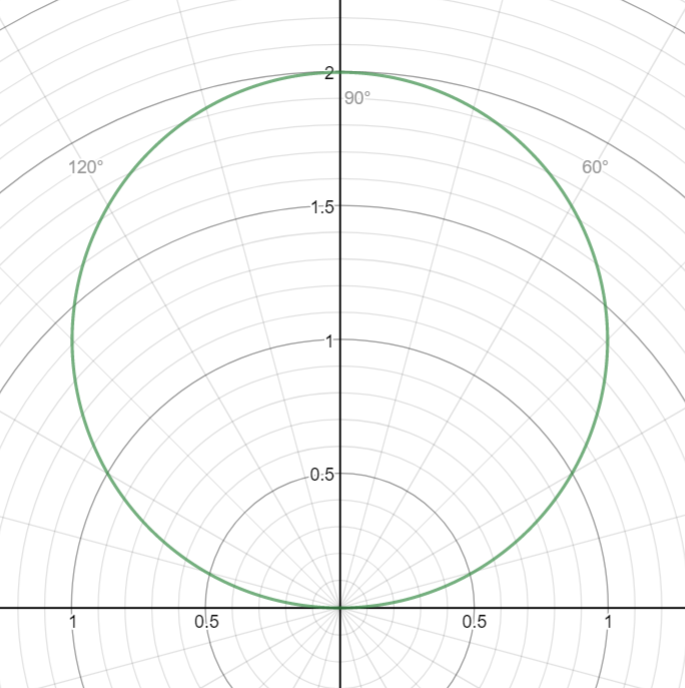
It is a circle with center at #(1,pi/2)# and radius #1#

and as #r=2sintheta# means #r^2=2rsintheta#

in rectangular coordinates, it is equivalent to #x^2+y^2=2y#