How do you solve the system of equations by graphing and then classify the system as consistent or inconsistent #y=-x-1# and #y=2x+14#?
1 Answer

Please read the explanation and refer to the graph.
Explanation:
We are given systems of two linear equations in two variables:
These can be visually represented by simultaneously graphing both the equations.
The system can be Consistent or Inconsistent and the equations in the system can either be Dependent or Independent.
A system which has No Solutions are said to be Inconsistent.
A system with one or more solutions are called Consistent, having either one solution or an infinite number of solutions.
We are given systems of two linear equations in two variables:
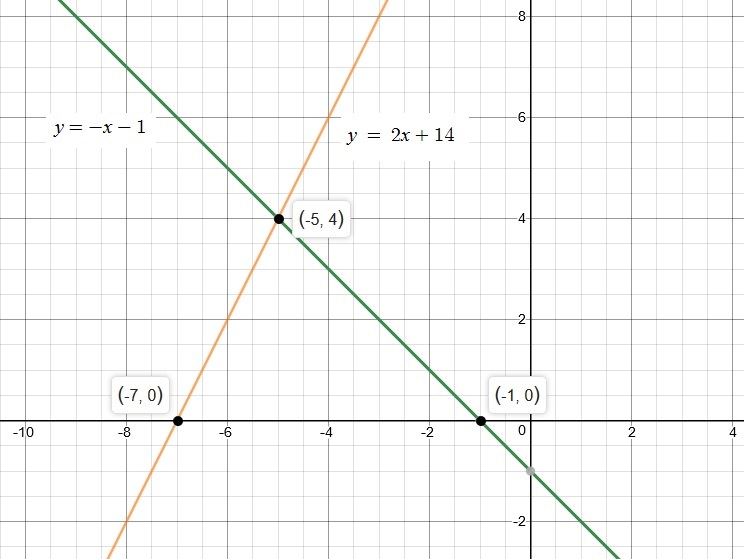
If you refer to the graph available with this solution, you can observe two distinct intersecting straight lines: one
We get a pair of
As you can observe, the intersection point has coordinates
Our system of equations is therefore a Consistent System of Independent Equations.
The solution set has single ordered pair
Our equations are in the Slope-Intercept Form:
Slope-Intercept Form is written as
We note that the Slope is different for each equation.
The system has one unique solution and therefore is a consistent system.
The equations are also Independent, as each equation is describing a different straight line.
I hope this helps.