Graphs of Linear Systems
Key Questions
-
It is possible for a system of equations to have no solution because a point on a coordinate graph to solve the equation may not exist.
This concept may seem hard to understand at first, but if you think about it, it comes easily!
The only way this can happen is if there is no intersection point, as this point would be the answer. And of course, if there is no intersection, then the lines are parallel.
Here's an example:
#y=4x+19#
#y=4x+7# Here, the slopes are the same, so the lines are parallel and never intersect. That being said, there is no solution to this problem!
Hope this helps!
 Marco
·
1
·
Nov 18 2014
Marco
·
1
·
Nov 18 2014
-
I assume that you are working with a linear system with two variables here. If the graphs of the equations happen to be identical, then we know that the system has infinitely many solutions since there are infinitely many intersection points between the lines, and those intersection points represent the solutions of the system.
I hope that this was helpful.
 Wataru
·
1
·
Nov 23 2014
Wataru
·
1
·
Nov 23 2014
-
Answer:
GRAPHING is always about actually plotting the points to obtain a representative diagram.
Explanation:
Whether it is done manually, one individual calculation at a time, or with a graphing program, graphing always requires the calculation of a set of values from the expressions.
It doesn't matter how many different equations you have. Linear sets are, of course, easier than many other function types. In any case, set up table with columns for the 'x' variable and the expressions in terms of the 'y' variable. The range and resolution of your x-values can be adjusted to get the type of graph you need.
A wide resolution may be enough to see the relative orientation of the set. A finer resolution at the intersection point may be needed if you want to find the solution. The main difference between a single line graph and a set of linear equations is that you do want to see both lines simultaneously on the same graph, which requires some preliminary calculations to determine the best range and resolution of the x-values.
Here's an example:
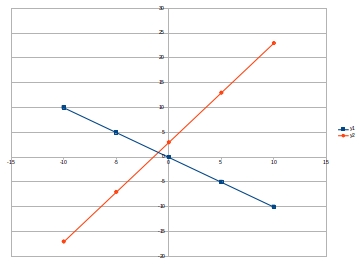
 SCooke
·
1
·
Apr 12 2018
SCooke
·
1
·
Apr 12 2018